
Google Colab Is a Free Cloud Computer, Here Is How to Use It
Google Colab gives anyone a free GPU and a code environment in the browser with no setup. Here is what it is, how notebooks work, and how I would put it to use inside a real trades business.

Most small business owners are told that AI tools require a budget and a developer. Google Colab proves that is a comfortable excuse, not a real constraint. I have watched owners spend money on consultants to produce analysis that was sitting in their own transaction records, already formatted, already complete, waiting for someone to ask the right question. The barrier to doing real data analysis on your own business numbers is not technical. It is not financial. It is the assumption that it must be hard because it sounds technical, and that assumption is wrong.
Google Colab is a free cloud computer with a browser interface. You do not install anything. You do not configure a Python environment. You do not pay for server time on the free tier. You open a tab, paste some code or use the built-in assistant to write it, and you run it. For a small business owner with a year of transaction data in a spreadsheet, that is enough to answer the questions that currently go unanswered because "we don't have an analyst."
The Setup-Time Comparison That Ends the Technical Excuse
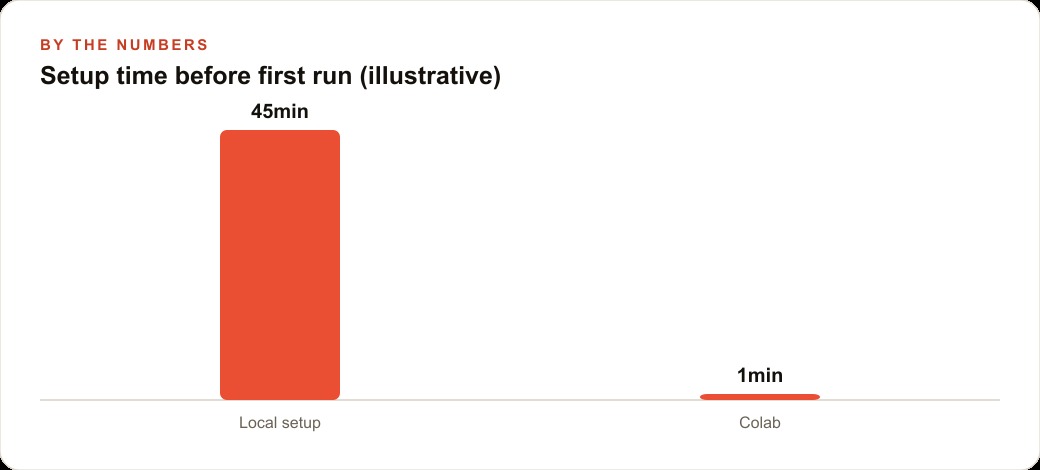
Here is what it costs to set up a local Python data analysis environment on a computer from scratch: download Python, install it, manage the PATH variable, install pip, create a virtual environment, install pandas and matplotlib and seaborn, open a Jupyter notebook server, deal with whatever dependency conflict comes up first. On a machine with no prior Python setup, you are looking at 30 to 60 minutes before you can run a single line of analysis code, and that assumes nothing goes wrong.
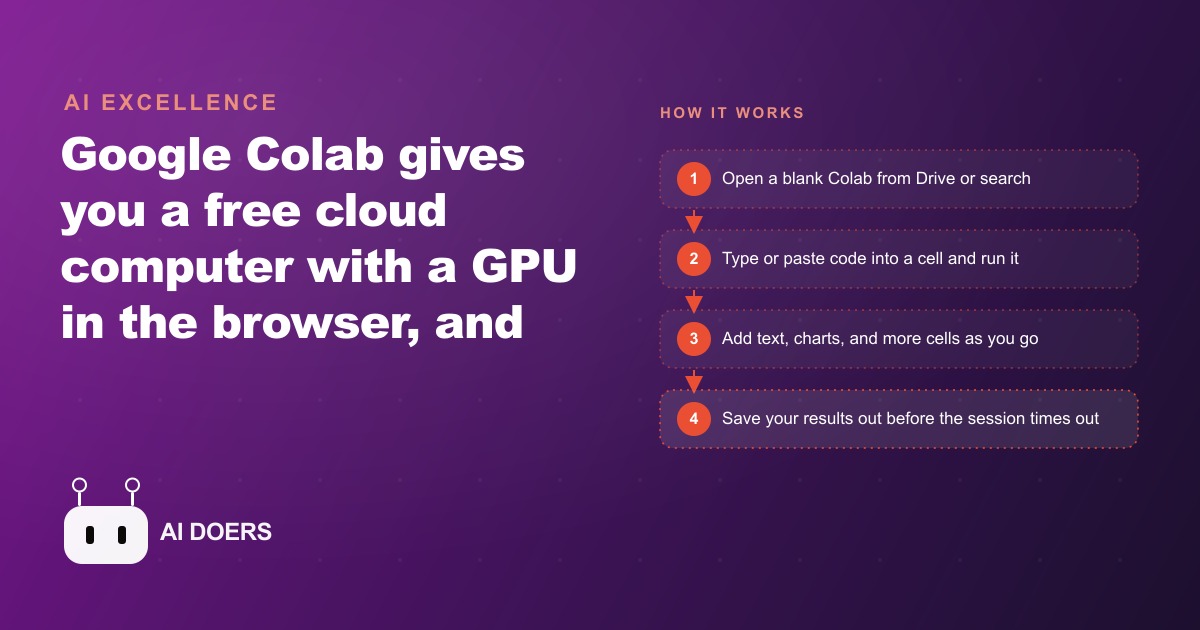
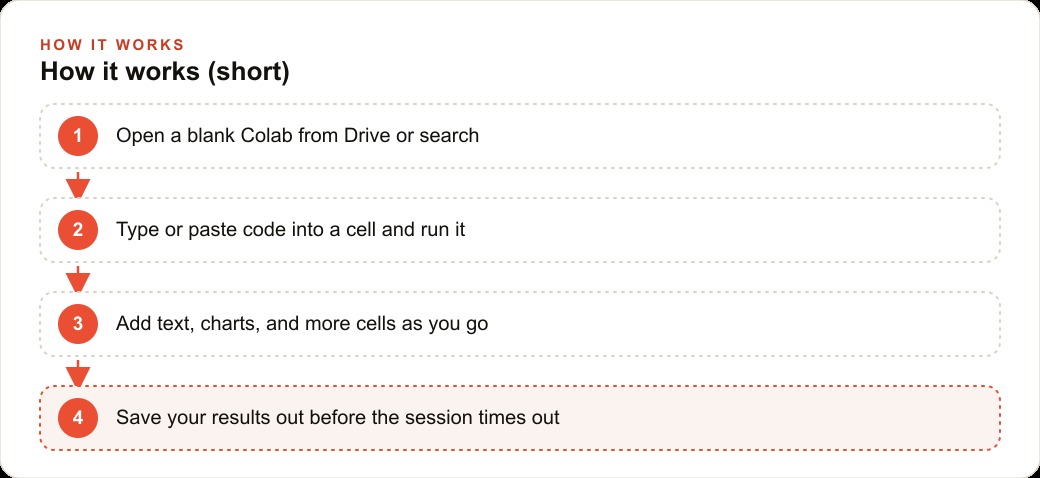
Here is what it costs to start a Google Colab session: go to colab.research.google.com, click New Notebook, type or paste code, press Shift+Enter. You are running in under 90 seconds.
I am not exaggerating for effect. The gap is real, and it matters for the specific person who is the audience for this article: a business owner who is not a developer, who does not want to become one, and who needs to look at their own numbers today, not after solving a local environment problem.
Colab comes with the major data libraries already installed. Pandas is there. Matplotlib is there. NumPy is there. For most small business analysis tasks, you will not need to install anything at all. For the cases where you do need a library that is not pre-installed, a single line of code handles it: `!pip install libraryname`. It takes about 15 seconds. This is not a skill barrier. This is a command you can type after reading it once.
The free tier includes access to a CPU runtime by default, and occasional access to a GPU runtime for more intensive workloads. For the kind of analysis a small business owner would actually do, which is loading a spreadsheet and producing charts and summaries, the free CPU runtime is more than sufficient. The only meaningful limitation on the free tier is session timeout: if the browser tab is inactive for about 90 minutes, the session disconnects and the in-memory variables are lost. Files saved to Google Drive are not affected. The variables, meaning the data you loaded and the calculations you ran, need to be re-run.
This is less of a problem than it sounds. A well-structured notebook is designed to be re-run from the top in one step. If your notebook loads the data in cell one and produces the analysis in cells two through ten, running all cells takes about 30 seconds and restores the full state. The session timeout is a quirk to know about, not a reason to avoid the tool.
The Run-Order Insight That Most People Learn Wrong
The thing about Colab that catches people off-guard is the difference between cell position and execution order. The cells in a Colab notebook are arranged visually from top to bottom, and the instinct is to assume that matters. It does not. What matters is the order in which you actually ran the cells.
If you run cell five before cell two, cell five executes without access to anything that would have been created in cell two. If cell two was the one that loaded your data file, cell five cannot see the data. It will produce an error that says something like "name 'df' is not defined," which looks cryptic but means: you tried to use a variable that has not been created yet in this session.
This is the insight I wish someone had explained to me in plain language on day one instead of letting me spend an hour debugging a notebook that was not broken. The notebook was fine. The execution order was wrong.
The practical rule is this: always run cells in order from top to bottom. If you edit a cell in the middle of the notebook, re-run it and every cell below it. If you start a fresh session after a timeout, use the Runtime menu to run all cells, not just the ones you remember needing. This keeps the state consistent and prevents the class of errors that looks like a code problem but is actually an order problem.
The built-in assistant helps with this when things go wrong. When a cell produces an error, there is an Explain Error button directly below the error message. It opens a panel that describes the error in plain English, suggests the likely cause, and often proposes a fix. For someone who is not a developer, this changes the experience of hitting an error from "this is broken and I don't know how to fix it" to "I understand what happened and here is the next step." That is not a small thing. It is the difference between stopping and continuing.
What the Electrician's Data Actually Showed
I want to give you a concrete example of what this tool produces when you actually use it on business data. An electrical contractor with about 4 years of completed job records uploaded a spreadsheet with columns for job date, job type, invoice amount, labor hours, parts cost, and zip code of the job site.
The first analysis took about 20 minutes to set up on the first session, and about 5 minutes to re-run in every subsequent session. It answered four questions.
First: which job types produced the highest total revenue per year? The answer was panel upgrades and EV charger installations, which were not the jobs that had been prioritized in marketing. The work the owner had been most aggressively advertising, residential fixture replacements, was producing about 40 percent of the revenue but requiring about 55 percent of the bookings to do it.
Second: which months were consistently slow? Looking at three years of job counts, February and July were the consistent low points, and they were low by enough to plan around. The owner had known that winters were sometimes slow but had not quantified the July dip before. The data showed it clearly: July job volume was running at about 60 percent of the annual average across all three years.
Third: which zip codes were producing repeat customers? A simple grouping by zip code and customer ID showed that three zip codes were producing between 70 and 80 percent of the return business. Those were not the zip codes where the most marketing was being spent.
Fourth: what was the actual margin per job type, accounting for both labor hours and parts cost? This was the most valuable analysis. The contractor had been pricing panel upgrades based on a rough estimate of what the market would bear. When the actual labor hours and parts costs were broken out per job, the margin on panel upgrades was running at 34 percent. EV charger installs, which were newer and felt riskier to price, were running at 41 percent. Fixture replacements were at 22 percent.
None of this required a data analyst. None of it required any software purchase. The spreadsheet export came from the existing invoicing software. The analysis ran in a free browser tab. The questions were the kind that any experienced contractor would know to ask if the answers were easy to get.
The insight about EV charger margins changed how the owner quoted that work in the next quarter. The insight about the slow months led to a pre-emptive price promotion in June for July scheduling. Neither of those decisions required a consultant or a BI tool.
Why the "I Don't Know How to Code" Objection Misses the Point
When I show this to business owners, the response is often: "That sounds useful but I don't know Python." I want to address that directly.
You do not need to know Python to use Google Colab for this purpose. You need to know what question you want to answer about your business. The code part can be delegated to the built-in assistant or to any AI assistant you use, and the assistant will write working code for a task like "load this spreadsheet and show me total revenue by job type" in under 30 seconds.
The skill you need is not programming. It is the ability to describe what you want to know in plain language. That is a skill every business owner already has, because you are living inside the question every day. You know whether your slow months are consistent. You know which service type feels underpriced but you have never measured it. You know which neighborhoods keep calling back and which ones do not.
The gap is not between you and the code. The gap is between the question you already have and the moment you sit down to ask it of the data. Google Colab closes that gap for free, in a browser, in under two minutes of setup.
What the First Session Actually Looks Like
I want to be specific about the mechanics of the first session so there is nothing abstract about what I am describing.
You open a new Colab notebook. You export your transaction data from whatever software you use, whether that is QuickBooks, a custom spreadsheet, or your invoicing software's CSV export. You upload the file using the small folder icon in the left panel of Colab. Once the file is there, you describe what you want to do in plain language to the built-in assistant: "I have a CSV file called jobs.csv with columns for date, job type, revenue, hours, and parts cost. Show me total revenue by job type as a bar chart." The assistant writes the code. You press Shift+Enter. The chart appears.
That is the first session. It does not require knowing what pandas is. It does not require understanding how matplotlib renders a chart. It requires knowing the name of your file and the name of your columns, which you can read directly from the spreadsheet you already have.
The second question usually takes about five minutes, because you already know where the file is and how the assistant works. Each subsequent question is faster than the one before it because you are building familiarity with a workflow, not learning a programming language.
For the electrical contractor, the first question was revenue by job type. The second was job count by month over three years. The third was which zip codes appeared most often in the customer column. Each produced a chart. Each chart produced a decision. None of it required anything other than a free browser tab and a CSV file the owner already had.
The Cost of Never Asking
Every year a business does not look at its own data is a year of margin decisions made on instinct rather than evidence. Instinct is not worthless. Experienced owners develop real intuition about their business from years of close observation. But instinct about which service has the best margin is not the same as knowing which service has the best margin. The gap between those two things can be measured in money.
The electrical contractor in this example had been in business for four years before doing this analysis. The EV charger margin insight was available on day one, because the invoicing data has been there since the first EV charger job. The question was not asked for four years because looking at the data seemed like a technical project.
It was not a technical project. It was 20 minutes in a free browser tab.
The question is not whether you can use this tool. You can. The setup is one tab, one upload, one run. The question is whether you are willing to ask your own data a question it has been ready to answer for years. That is not a technical barrier. That is a decision.
That is exactly what we do at AI DOERS. Book a private 30-minute call with Madhuranjan Kumar and we will map the fastest path to it for your specific business.
Book your call →
Madhuranjan Kumar
Madhuranjan Kumar brings 20 years of performance-marketing experience and has managed over $200 million in Facebook ad spend for brands across the United States and beyond. His expertise spans the full modern marketing stack: Meta, Google Ads, TikTok, email automation, CRM, and the websites that hold it together. At AI DOERS he turns that track record into lead-generation systems for businesses across every industry.